A Deep Analysis of the "Timing the Market Is Impossible" Argument
The claim that timing the market is impossible has been widely accepted, largely due to studies such as those conducted by Hartford Funds. While the numbers and charts in these studies are correct, the conclusions drawn from them can be misleading. Consider the following statement:
"Avoiding the market’s downs may mean missing out on the ups as well. 78% of the stock market’s best days occur during a bear market or during the first two months of a bull market. If you missed the market’s 10 best days over the past 30 years, your returns would have been cut in half. And missing the best 30 days would have reduced your returns by an astonishing 83%."
Why Is This Misleading?
This argument assumes that an investor who missed the best days also held onto the worst days, which is not necessarily the case.
- Best days often coincide with the worst days. For example, major market rebounds frequently follow sharp declines, making the "best days" closely associated with preceding downturns.
- Historical data supports this claim. A look at the largest daily changes in the Dow Jones Industrial Average confirms that the biggest upswings occur near significant downswings (source).
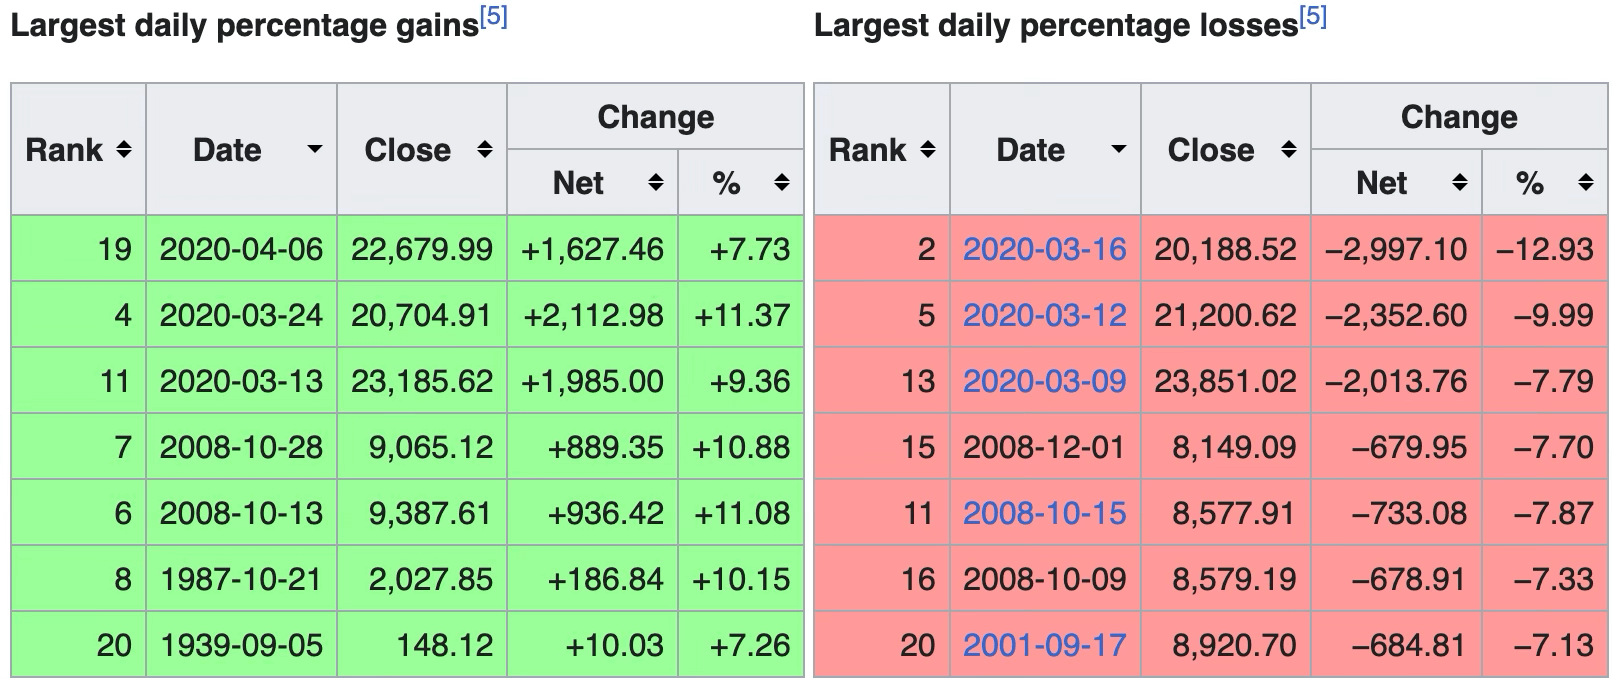
Observations from the Data
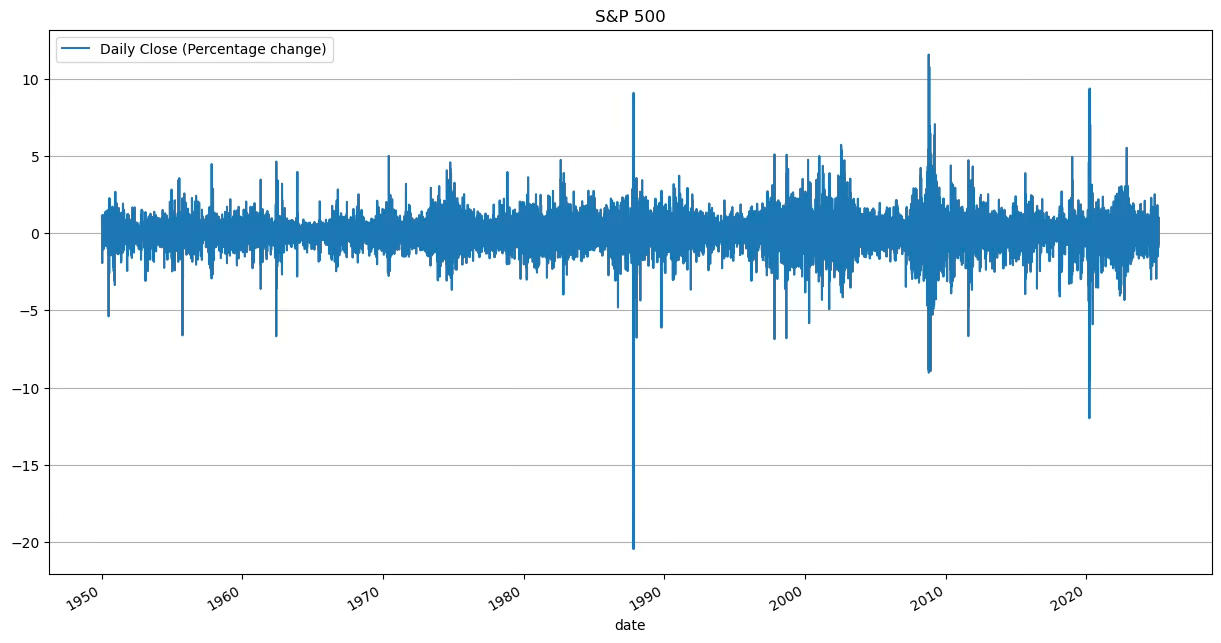
Below is a graphical representation of market movements, showing that highs tend to appear in close proximity to equivalent lows:
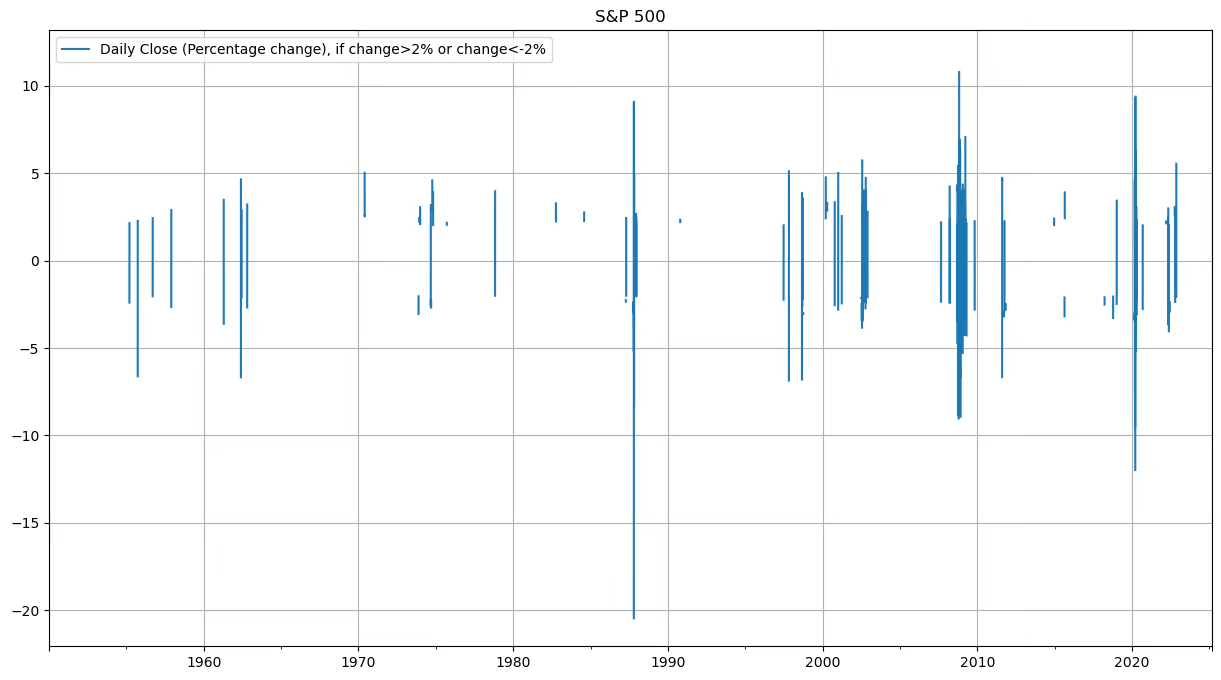
For additional clarity, we plotted only the daily changes greater than +2% and less than -2%. This visual makes it evident that market surges and declines frequently occur together, with only a few exceptions.
Evaluating a Different Scenario
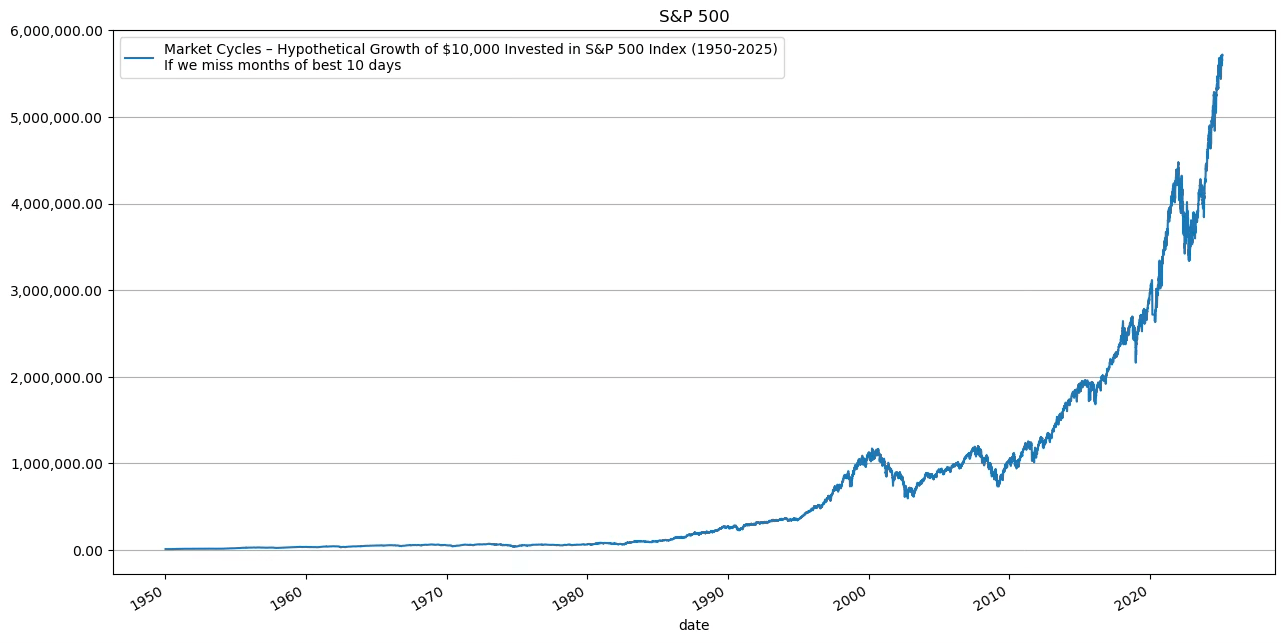
To test the validity of the "missing best days reduced your returns by an astonishing 83%." argument, let's analyze what happens when we exclude entire months that contained the best-performing days.
Using data from 1950 onward (matching the period referenced in the original argument), we removed the entire month in which each of the best-performing days occurred.
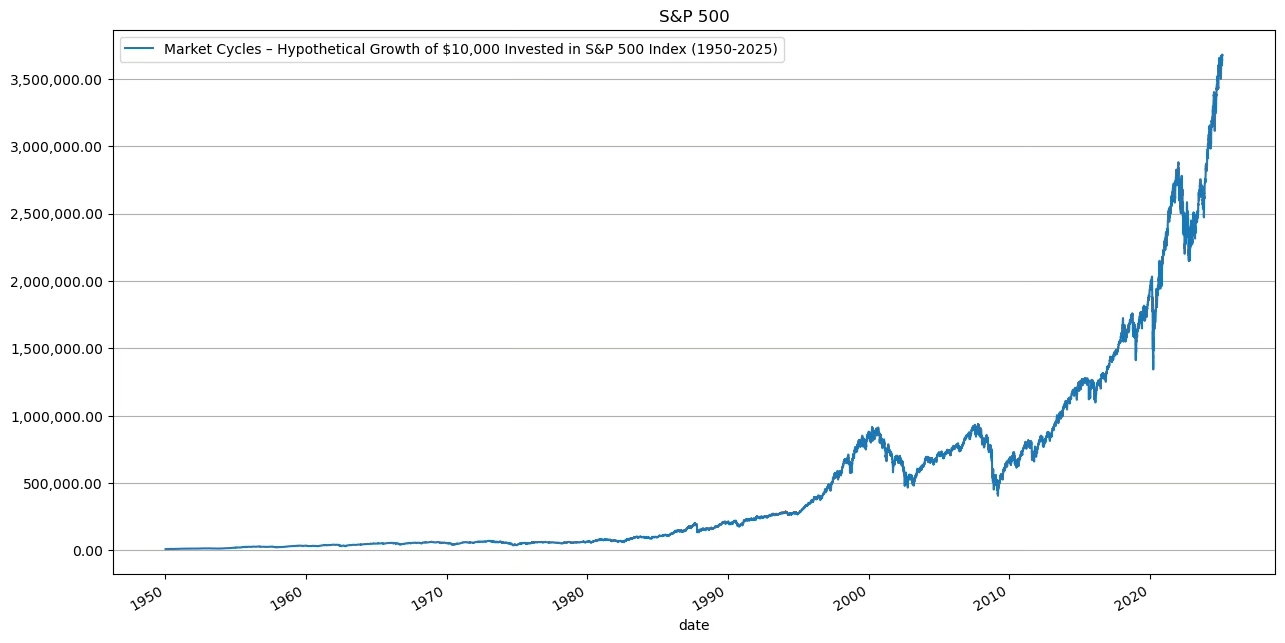
If we invested $10,000 in 1950 then it would have been $3,677,875.09 Today (19th Feb)
List of the 10 Best-Performing Days (1950–2025)
| Date | Percentage Change |
|---|---|
| 2008-10-13 | 11.58% |
| 2008-10-28 | 10.79% |
| 2020-03-24 | 9.38% |
| 2020-03-13 | 9.29% |
| 1987-10-21 | 9.10% |
| 2009-03-23 | 7.08% |
| 2020-04-06 | 7.03% |
| 2008-11-13 | 6.92% |
| 2008-11-24 | 6.47% |
| 2009-03-10 | 6.37% |
Let’s remove these months from our analysis. If we invested $10,000 in 1950 and miss 10 best performing days months then it would have been $5,717,274.59 Today (19th Feb)
Portfolio Growth Analysis
- If an investor had placed $10,000 in the market in 1950, it would have grown to $3,677,875.09 by February 19 of this year.
- If the investor had removed the months containing the 10 best-performing days, their portfolio would have grown to $5,717,274.59—significantly more than if they had stayed invested in all periods.
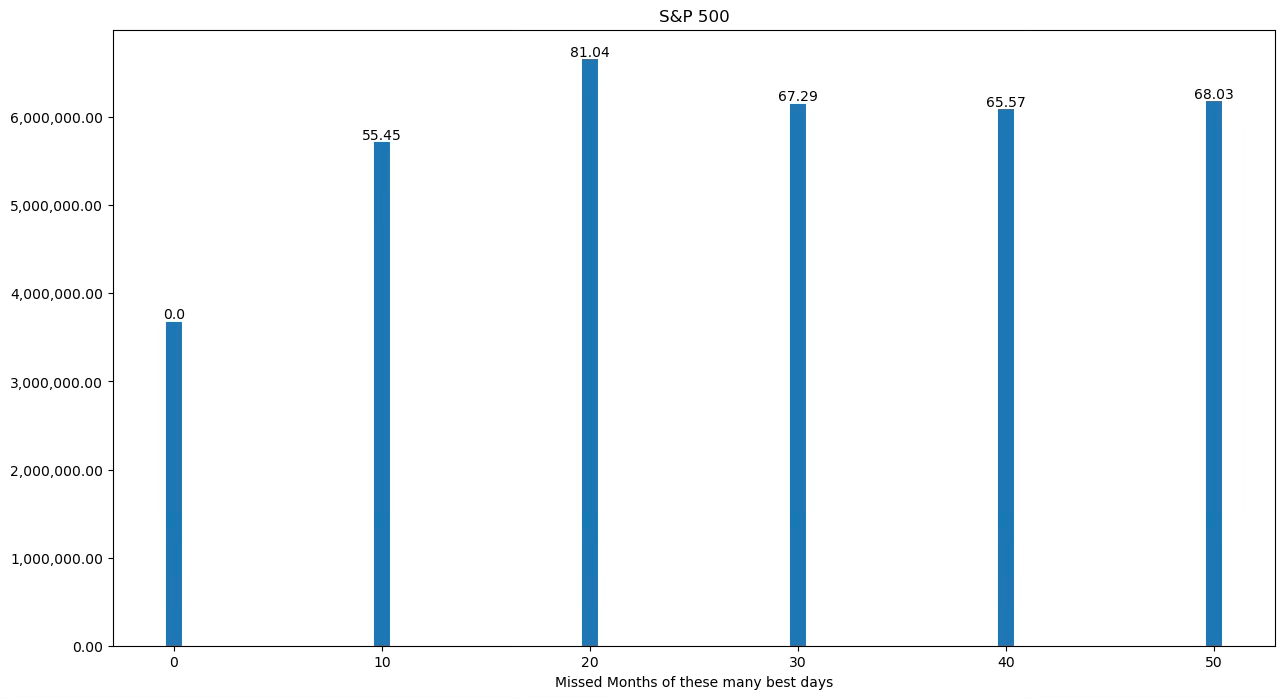
Missing the Market’s Months of Best Days Has Been Profitable. More data to support this. Graph also shows % gain when you do miss those months.
Conclusion
The findings demonstrate that missing the best days by avoiding entire months containing them has actually resulted in higher portfolio returns.
This contradicts the commonly cited "market timing is impossible" argument, emphasizing that strategic timing and risk management play a crucial role in investment success. Even legendary investors like Warren Buffett exhibit market timing tendencies in their 13F filings.
Next Steps
The key question now is: How do we identify the right timing strategies to maximize results? We will explore this in the next part of this series.
If you found this analysis insightful, please share it to help others gain a new perspective on market timing!
Timing the Market Is Possible Part 2. Really.
license: "Creative Commons Attribution-ShareAlike 4.0 International"