In Previous post, we debunked the argument that "Timing the Market Is Impossible".
That debunking left users wonder that how to find out those months up ahead, where crash happens. Some even called those months as Magic months to debunk our debunking. We also knew that this was the serious shortcoming in previous post. However, that post meant only for debunking the argument. In this post, we will give you (or just point you to) some simple strategies that can work to make better returns than leave it to market with no strategy.
Rolling Window Strategies
In these rolling window strategies, We will calculate returns of last N market days then simply add them together.
Let's say rolling window length is 5 and return for last 5 days are 1.2%, 1.8%, -0.2%, 2.1% and 1.1%. Returns are calculated on closing price of the day.
For this example returns of last N market days will be 6%, calculated as follows.
1.2% + 1.8% - 0.2% + 2.1% + 1.1% = 6%
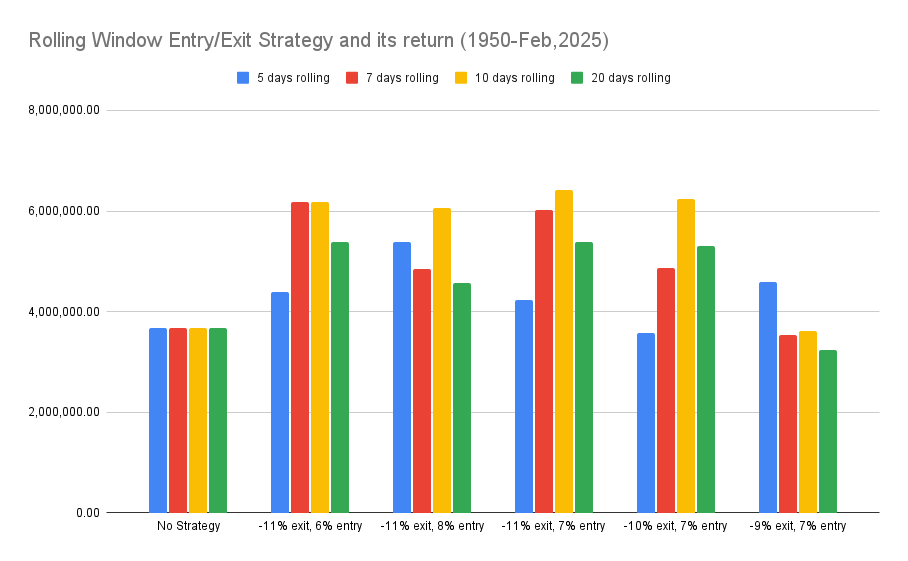
Strategies (from 1950s to Feb 2025)
We will be considering 4 rolling windows named 5 days rolling, 7 days rolling, 10 days rolling, & 20 days rolling.
Strategies are based on $10,000 investment back in 1950 and written as follows,
- -11% exit, 6% entry : In this we will exit market when rolling window give -11% return and enter again only if rolling window give 6% return.
- -11% exit, 7% entry : In this we will exit market when rolling window give -11% return and enter again only if rolling window give 7% return.
- -11% exit, 8% entry
- -10% exit, 7% entry
- -9% exit, 7% entry
These strategies are choosen specifically to give idea that no all strategies are equal. You can also vary exit and entry rolling windows on different window size. However, scope of this document is to show that such strategies are possible not explore exaustive list of these strategies.
One question will be, How many times Portfolio needs to be exited or enter again for these strategies?
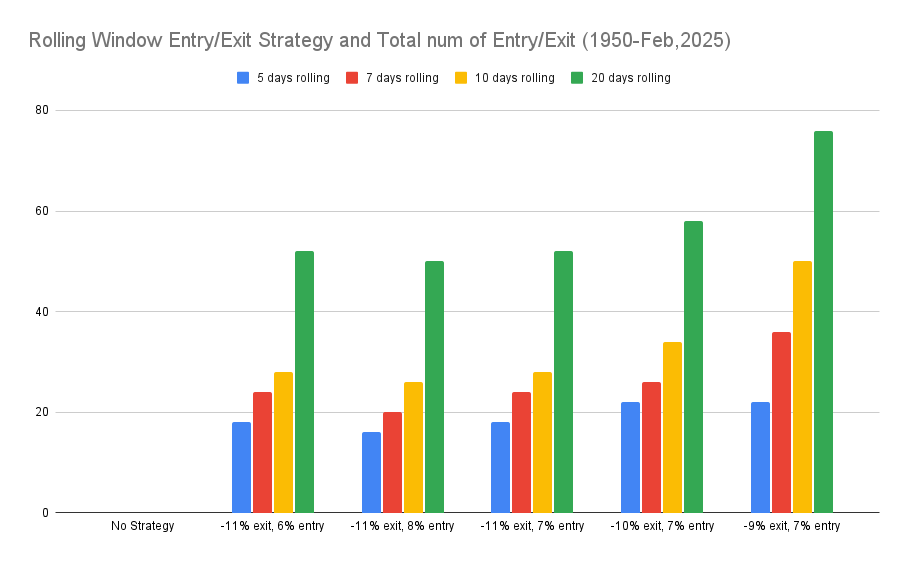
Note: both entry & exit calculated separate here not in pairs.
Strategies (from 1995s to Feb 2025)
Same Strategies on different time frame.

Another question could be, how much efficient these strategies are compared to No strategy?
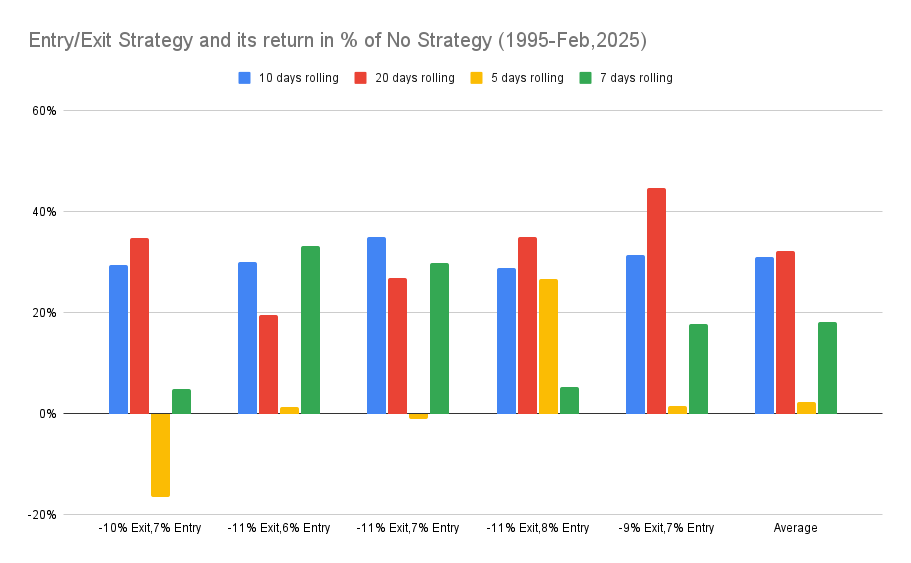
If we remove 5 days rolling windows then there is average of 27% upside than No strategy and max upside of 45% even with our simple strategies here.
Next Steps
The key question for readers is to identify: Which strategies can give you better results than these simple strategies?
If you found this analysis insightful, please share it to help others gain a new perspective on market timing and exploration of new strategies.
Thank you for reading!
license: "Creative Commons Attribution-ShareAlike 4.0 International"